The City That Works: An Exploratory Analysis of Baltimore City Employee Salaries

If you're viewing this on your phone, I'd recommend enabling desktop mode. In Google Chrome, you can do so by tapping the three dots at the top right of your screen. Desktop Site usually has a checkbox next to it that you fill to enable the change. You can zoom in and out of any section with your fingers. My apologies for the hassle and thanks for reading!

Purpose

Here, I go through an exploratory analysis of Baltimore city employee salaries. I obtained all data through the City of Baltimore's Open Baltimore Data platform (OBD). I wanted to describe and illustrate a process for taking publicly available data and using it to conduct basic data analysis and visualization. All tools used here are free and open source (Google Cloud is a slight exception, but the free tier will get you pretty far).

Summary

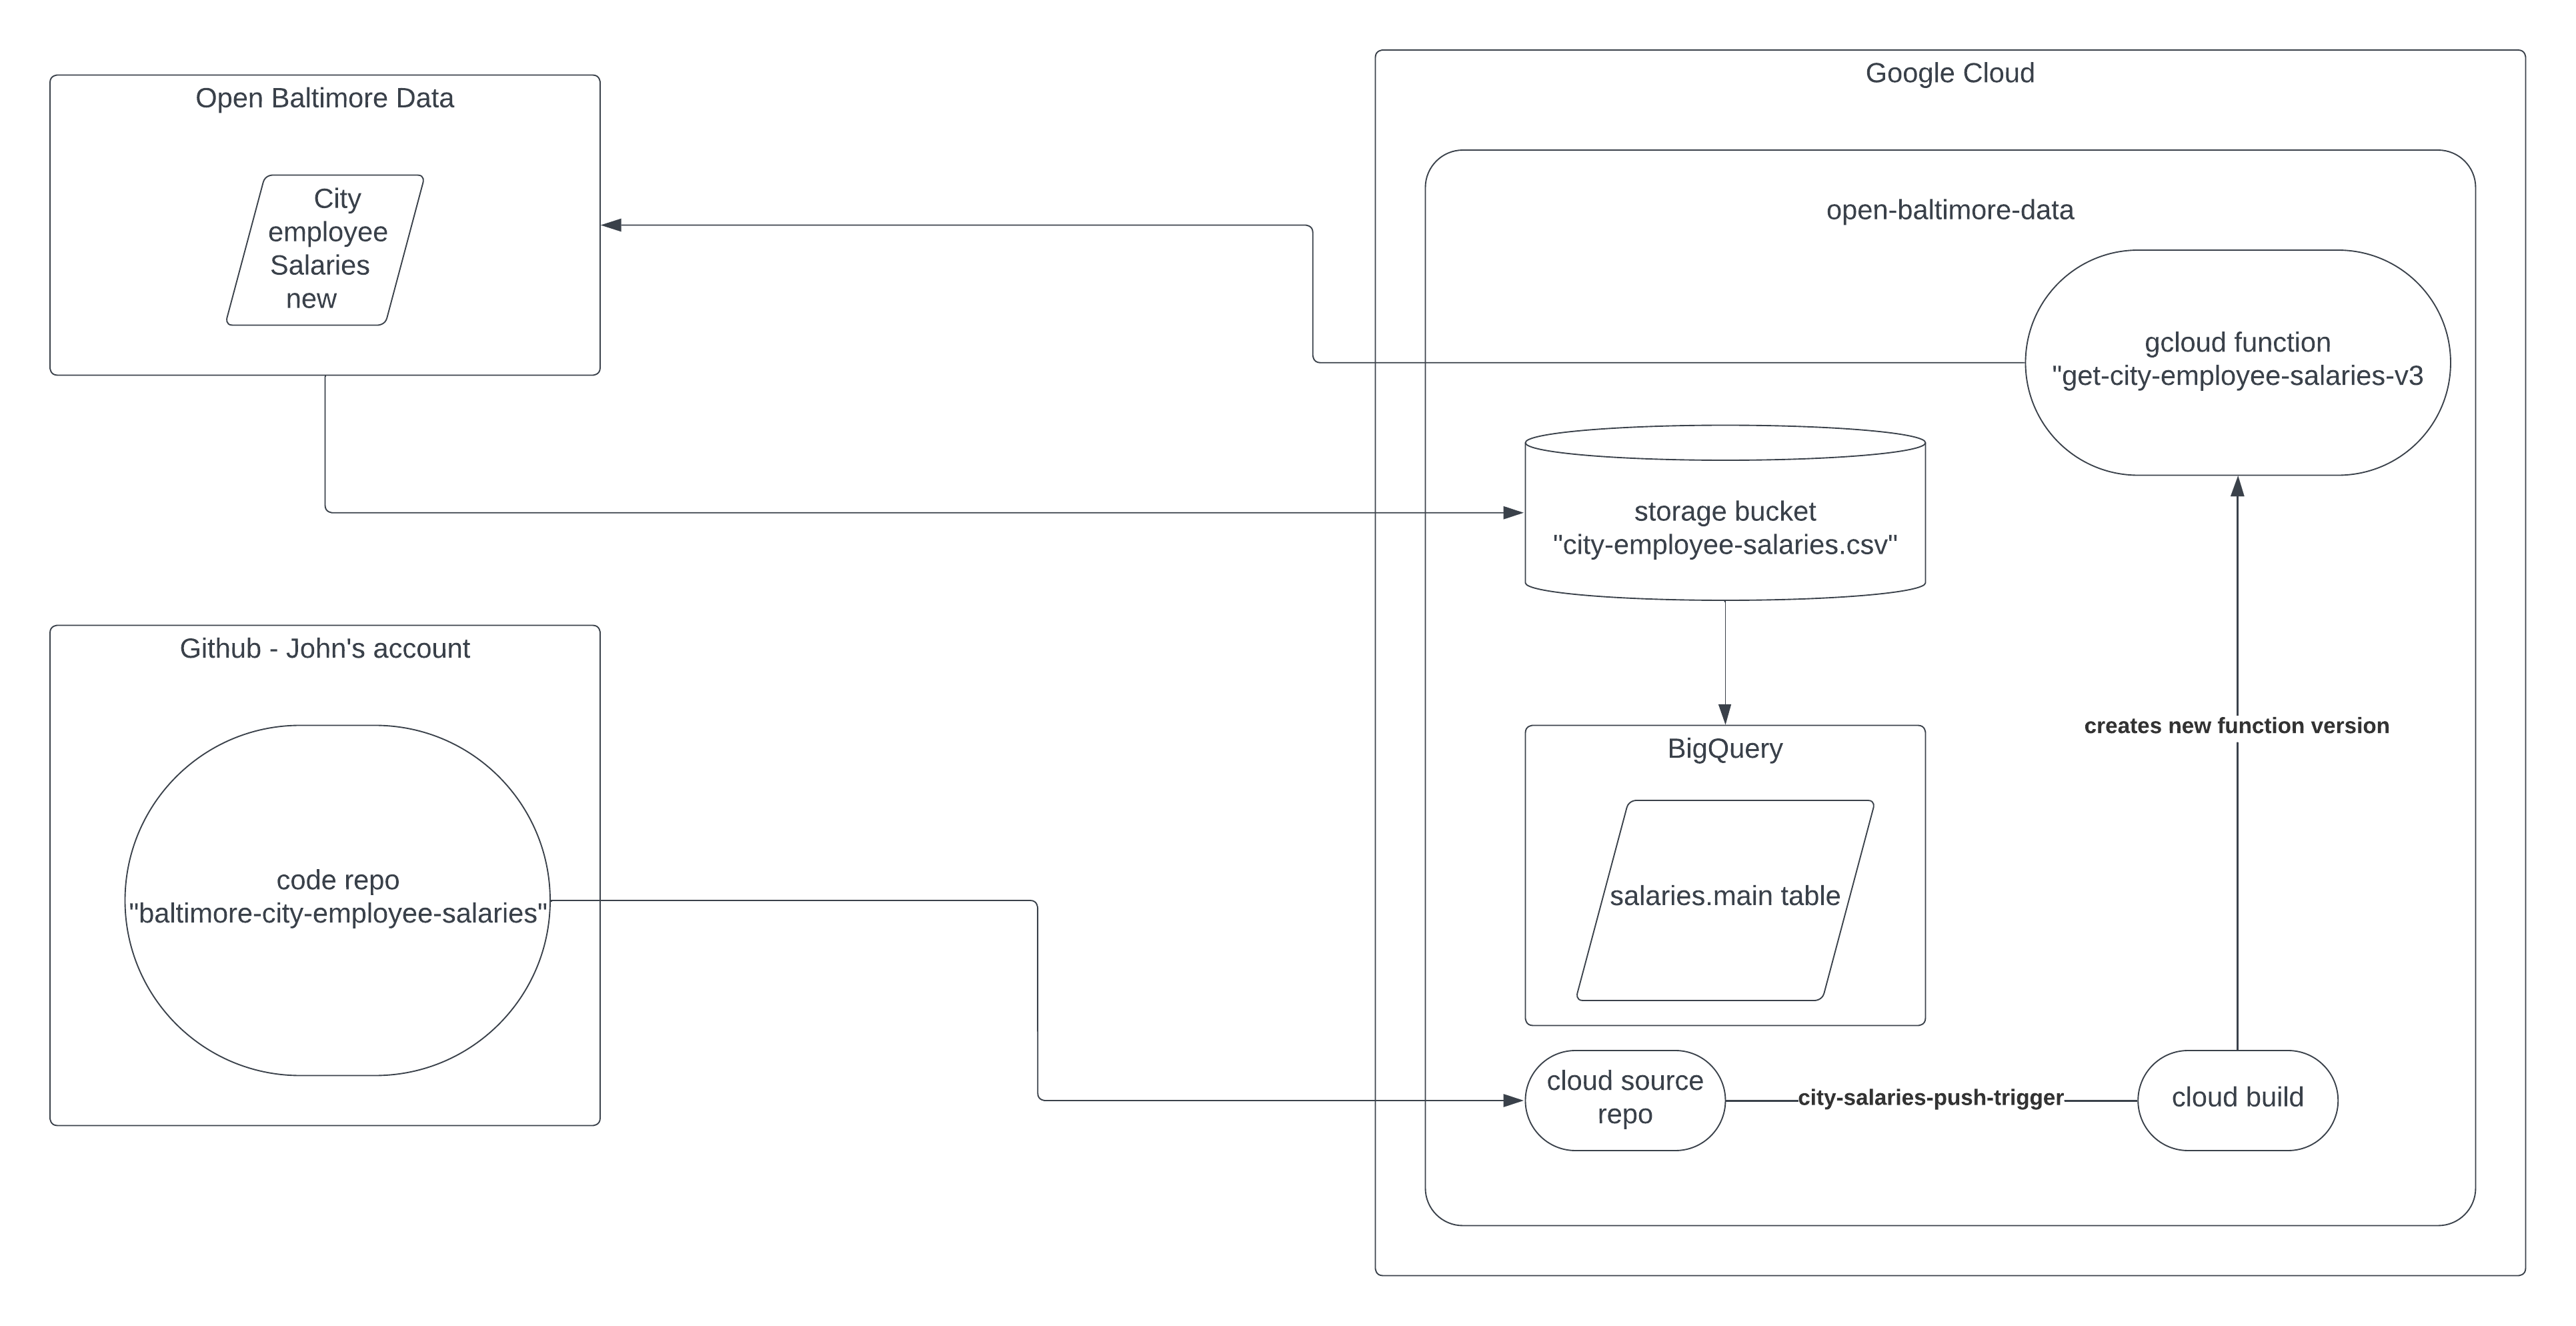
I created a small Python function that batches calls to the OBD Rest API. I connected the GitHub repo I stored the Python code in to a gcloud source repo. Each time I push a change to the master branch, GH notifies gcloud and Cloud Build uses the updated cloud source repo to deploy a new version to Cloud Function. Since OBD appears to only update the data once per year or so, I run the function manually. However, Cloud Scheduler would run my function at any interval I want using cronjobs.

Once the function finishes querying OBD, it stores the data in a csv in Cloud Storage. From there, I connect the csv to a BigQuery table. I considered updating the function to write directly to the BigQuery table, but I want to see how regularly OBD updates this data set going forward and if they change the schema. They've changed the schema for this dataset at least once that I've seen. I'll add some other details about this data set and a flow chart in the technical notes below.

Technical Notes and Disclosures

  • OBD only has one name field, which made it difficult to group records by person for analysis. For example, I previously combined the firstName, lastName, and middleInitial fields with AgencyID to create an employeeSlug that I use to track workers across organizations. With just the Name and AgencyID fields to work with in this release, tracking individual workers is difficult, though not impossible. It'll definitely be the work of a future analysis. This initial analysis focusses on agency-level salary measures.
  • I excluded salary records where the agency had less than 500 salary records total or the record omitted the HireDate field. I wanted to keep the initial anaylsis as robust as possible, so I elected to clean the data in this way. I also excluded records that were missing data in the annualSalary fields since those fields were essential to my measures for this initial analysis.
  • I regrouped the raw AgencyName values because the data set duplicated some agency names, made distinctions inside of an agency I didn't want to keep, etc. For example, OBD broke out "Rec & Parks" to "Rec & Parks - Parks", "Rec & Parks - part-time", "Rec & Parks - Admin", etc.

City Salaries Data Set API Request Flow

First Things First

Gotta get the data in! As I noted in the beginning, I stored this data in a BigQuery table. So the first step is to query the table and bring in the salary and employee name data I want. After I created a Google Cloud account and project, I installed the Google Cloud SDK for Python. Lots of trial and error, but overall a pretty straigtforward process. Unfortunately, I don't have a very comprehensive set of links to show y'all how to get started on Google Cloud if you wanted to recreate this setup, but I'll list the basic steps below:

  1. Create a Google Cloud account (pretty easy if you already have a gmail, also easy if you don't)
  2. Create a Google Cloud project
  3. Create a BigQuery table
  4. Install the Cloud Client Libraries for Python
  5. Install the gcloud CLI
  6. Set up Application Default Credentials
    • I do have a link for this! and it's what allows me to just supply a project_id and nothing else to connect to my gcloud instances. Highly recommend this and it was very easy.

Once all that is done, you can run some version of the code below and bring your data in for analysis.

In [1]:
# import necessary libraries
from google.cloud import bigquery
import pandas as pd
import numpy as np
import datetime as dt
from dateutil import relativedelta as rd
import plotly.express as px

# build client to connect to open-baltimore project
project_id = "open-baltimore-data"
client = bigquery.Client(project=project_id)
In [2]:
# import employee name info
employee_salaries_query = client.query(
    """
    SELECT 
        info.employeeSlug,
        main.objectId,
        TRIM(REGEXP_REPLACE(main.agencyName, r'\(.*?\)', '')) as agencyName,
        main.agencyId,
        main.annualSalary,
        main.fiscalYear,
        main.hireDate
    FROM city_employee_salaries.main as main
    LEFT JOIN city_employee_salaries.employee_info as info
    ON main.ObjectId = info.ObjectId
    """
)
employee_salaries = employee_salaries_query.result().to_dataframe()

Cleaning, Cleaning, Cleaning

Here, I created my own dictionary for translating existing city agency names to my own. I also filtered out records with no salary data. Then I used map to populate a cleanAgencyName column with the new names. map loops over each record in the existing agencyID field, checks my dictionary for a match, then returns the matches in the new column. It's a super fast function and the syntax is very simple. Lastly, I converted the hireDate field to datetime format so I can calculate tenure.

In [3]:
# clean fields for analysis
agency_dict =  {
    "A01": "Mayors Office",
    "A02": "City Council",
    "A02": "Mayors OED",
    "A04": "Rec & Parks",
    "A05": "MONSE",
    "A06": "Housing & Community Dev",
    "A08": "M-R Human Services",
    "A09": "Liquor License Board",
    "A10": "Mayors Office of Children & Families",
    "A11": "Office of the Inspector General",
    "A12": "Finance",
    "A14": "Finance",
    "A15": "Comptrollers Office",
    "A16": "Comptrollers Office",
    "A17": "Finance",
    "A18": "Finance",
    "A19": "City Planning",
    "A23": "Finance",
    "A24": "Comptroller - Audits",
    "A26": "M-R Labor Commissioner",
    "A28": "Wage Commissioner",
    "A29": "States Attorneys Office",
    "A30": "Law Department",
    "A31": "Circuit Court",
    "A32": "Finance",
    "A33": "Legislative Reference",
    "A35": "Elections",
    "A37": "Orphans Court",
    "A38": "Sheriffs Office",
    "A39": "311",
    "A40": "BCIT",
    "A41": "DPW - Admin",
    "A44": "M-R Cable & Comms",
    "A46": "Environmental Control Board",
    "A49": "Transportation",
    "A50": "DPW - Waste & Wastewater",
    "A51": "Office of Equity & Civil Rights",
    "A52": "Employee Retirement System",
    "A53": "Finance",
    "A54": "Retirement - Fire & Police",
    "A57": "City Council Services",
    "A64": "Fire Department",
    "A65": "Health Department",
    "A67": "Rec & Parks",
    "A68": "Rec & Parks",
    "A70": "DPW - Solid Waste",
    "A73": "Municipal Zoning & Appeals",
    "A75": "Enoch Pratt Free Library",
    "A83": "Human Resources",
    "A84": "Transportation",
    "A85": "General Services",
    "A86": "War Memorial Commission",
    "A88": "Comptroller - Comms",
    "A90": "Transportation",
    "A91": "Convention Center",
    "A99": "Police Department",
    "A9": "Police Department",
    "B49": "Transportation",
    "B68": "Rec & Parks",
    "B70": "DPW - Solid Waste",
    "BPD": "Police Department",
    "C90": "Transportation - Crossing Guards",
    "P04": "Rec & Parks",
    "P65": "Health Department",
    "P83": "HR Test Monitor",
    "R01": "R01",
    "U01": "U01",
    "SCS": "Special City Services",
    "W02": "Youth Summer Works",
    "W03": "Youth Cust",
    "W07": "Youth Temp Adult",
    "W08": "TANF Cust"
}
employee_salaries_clean = employee_salaries.copy(deep=True)
employee_salaries_clean = employee_salaries_clean[employee_salaries["annualSalary"].notnull()
                                      & employee_salaries["annualSalary"] != 0]
employee_salaries_clean['cleanAgencyName'] = employee_salaries_clean['agencyId'].map(agency_dict)
employee_salaries_clean = employee_salaries_clean[employee_salaries_clean["hireDate"].notnull()]
employee_salaries_clean['hireDate'] = pd.to_datetime(employee_salaries_clean["hireDate"], unit="ms")
# may need to implement check and ensure tenure across unique employees is the same
employee_salaries_clean['tenure'] = \
    employee_salaries_clean['hireDate'].map(lambda hire_date: rd.relativedelta(dt.datetime.now(), hire_date).years)                                       

Initial Aggregations

Once I noticed I had actual employee names, I really wanted to try to track employees across years. I tried to create a slug but since there's only one Name field, employees with multiple records can have one record with a middle initial and one without. This would look something like Owens,Dyan-S-D01 and Owens,Dyan-NA-D01 labeled as different employees when they're the same person. I don't imagine this is a huge proportion of the records and there's a couple cleaning methods I could employ to make the employeeSlug more reliable. Once again, that'll probably be in a future analysis.

Employee-wise

Regardless, I wanted to start by counting salary records by agency. This got me to the 500 record cutoff I used to keep my measures robust. Then, I ran measures by employee and agency. I calculated 7 measures to start:

  1. medSalary
    • the median salary for each employee
  2. highestSalary
    • the higest salary reported for each employee
  3. lowestSalary
    • the lowest salary reported for each employee
  4. growth
    • the difference between an employee's highest reported salary and an employee's lowest reported salary
  5. salaryRecords
    • total number of salary records reported for each employee
  6. tenure
    • based off the hireDate field I formatted earlier in the analysis. Each hireDate record for each individual employee should be the same. So I can use the first function to simply take the tenure field I calculated for each record. It's somewhat of a dynamic field since I get it by subtracting the number of years between the current date and the hire date provided. It rests on a lot of assumptions and is not a very straightforward measure to calculate. I definitely want to find a better way to calculate this going forward.
  7. avgRaise
    • here I just took the difference between the highest and lowest salary and divided that by the number of salary records. This could be slightly misleading because it's possible that the highest salary is not the most recent salary and the lowest salary is not the earliest salary. That would mean employees aren't really getting raises each year but this measure makes it seem like they are.

Agency-wise

Once I made it to the breakdown by city agency, I took most of the measures listed above and calculated their median. I chose the median because I figured like many organizations, the city probably pays those at the top very well and those at the bottom...less well. The mean is very sensitive to these outliers and the median is not. I'd love to do a modal breakdown in a future analysis. I'd probably create pay ranges of some kind so we can see what percentage of employees across the city fall into different ranges.

In [4]:
# count number of records per city agency
agency_record_count = employee_salaries_clean.groupby(["cleanAgencyName"], as_index=False).agg(
    salaryRecords=pd.NamedAgg(column="cleanAgencyName", aggfunc="count")
    )
agencies_with_500_records = agency_record_count[agency_record_count["salaryRecords"] >= 500]["cleanAgencyName"].values.tolist()   
# calculate mean salary, max salary, min salary, growth, salary records, tenure, average raise by employee and agency
employee_salary_quality = employee_salaries_clean.groupby(["employeeSlug", "cleanAgencyName"], as_index=False).agg(
    medSalary=pd.NamedAgg(column="annualSalary", aggfunc="median"),
    highestSalary=pd.NamedAgg(column="annualSalary", aggfunc="max"),
    lowestSalary=pd.NamedAgg(column="annualSalary", aggfunc="min"),
    growth=pd.NamedAgg(column="annualSalary", aggfunc=lambda salary: max(salary) - min(salary)),
    salaryRecords=pd.NamedAgg(column="annualSalary", aggfunc="nunique"),
    tenure=pd.NamedAgg(column="tenure", aggfunc="first"),
    avgRaise=pd.NamedAgg(column="annualSalary", aggfunc=lambda salary: (max(salary) - min(salary)) / len(salary))
    )
agency_salary_quality = employee_salary_quality.groupby(["cleanAgencyName"], as_index=False).agg(
    medSalary=pd.NamedAgg(column="medSalary", aggfunc="median"),
    medHighestSalary=pd.NamedAgg(column="highestSalary", aggfunc="median"),
    medLowestSalary=pd.NamedAgg(column="lowestSalary", aggfunc="median"),
    medGrowth=pd.NamedAgg(column="growth", aggfunc="median"),
    medTenure=pd.NamedAgg(column="tenure", aggfunc="median"),
    medRaise=pd.NamedAgg(column="avgRaise", aggfunc="median")
    ).query("cleanAgencyName in @agencies_with_500_records")
agency_salary_quality.style.hide(axis="index")
Out[4]:
cleanAgencyName medSalary medHighestSalary medLowestSalary medGrowth medTenure medRaise
BCIT 46319.000000 46747.000000 45963.000000 932.000000 17.000000 466.000000
Circuit Court 56363.000000 60411.000000 54049.000000 0.000000 14.000000 0.000000
Convention Center 37752.000000 39271.000000 36167.000000 600.000000 14.000000 228.000000
DPW - Admin 55511.000000 57653.000000 53191.000000 0.000000 10.000000 0.000000
DPW - Solid Waste 35615.000000 37613.000000 34411.000000 0.000000 16.000000 0.000000
DPW - Waste & Wastewater 40646.000000 44151.000000 38411.000000 1636.000000 17.000000 552.666667
Enoch Pratt Free Library 40570.000000 42959.000000 37677.000000 0.000000 13.000000 0.000000
Finance 43155.000000 45589.000000 41515.000000 0.000000 14.000000 0.000000
Fire Department 70393.000000 73583.000000 62175.000000 6194.000000 18.000000 1446.400000
General Services 43784.000000 48637.000000 41771.000000 1159.000000 15.500000 487.250000
Health Department 42907.000000 44153.000000 40823.000000 0.000000 12.000000 0.000000
Housing & Community Dev 49871.000000 52639.000000 46583.000000 0.000000 14.000000 0.000000
Police Department 68165.000000 75183.000000 61183.000000 1470.000000 16.000000 685.000000
Rec & Parks 35615.000000 37571.000000 33849.000000 0.000000 9.000000 0.000000
Sheriffs Office 50696.000000 54059.000000 46495.000000 2870.000000 18.000000 1027.000000
States Attorneys Office 62481.000000 64957.000000 57699.000000 0.000000 10.000000 0.000000
Transportation 39745.000000 42455.000000 37553.000000 998.000000 17.000000 392.000000
Transportation - Crossing Guards 10822.000000 11875.000000 9891.000000 0.000000 16.000000 0.000000

Whoa, that's a disparity

I don't use a lot of box plots, but here it works well. The boxes show you the maximum, minimum, and median salary for each agency. You can also see salaries at the 25th (q1) and 75(q3) percentiles. The numbers here are not grouped by individual employee, so they may look a little different than the table above.

In [5]:
# add salary box plot
ordered_salary_data = employee_salaries_clean.query("cleanAgencyName in @agencies_with_500_records").loc[:, ["cleanAgencyName", "annualSalary"]] \
    .groupby(["cleanAgencyName"]) \
    .median() \
    .sort_values(by="annualSalary", ascending=False)
fig = px.box(employee_salaries_clean.query("cleanAgencyName in @agencies_with_500_records"), 
             x="cleanAgencyName", 
             y="annualSalary", 
             points=False, 
             category_orders={"cleanAgencyName": ordered_salary_data.index.to_list()},
             labels=dict(cleanAgencyName="City Agency", annualSalary = "Annual Salary ($)")
             )
fig.show()

Closing thoughts

  1. Agencies with highest percentage of employees living in Baltimore City pay their employees the least (link to Employees by Residence)
    • Crossing Guards (94%), Solid Waste (84%), Convention Center (72%), Rec and Parks (77%) are bottom four by med salary
      • a significant portion of these employees may be part-time (especially crossing guards) or working an entry-level job that doesn't require an advanced degree. that being said work is work and I think we're failing by not paying essential city workers a livable wage when most of them live and pay taxes here.
    • Police (23%), Fire Dept (31%), State's Attorney's Office (42%), Circuit Court (52%) are top four by med salary
    • Excuse my bluntness, but that's pretty jacked up. I think there's a lot to explore there that goes beyond the scope of this analysis. Suffice to say, I don't think it's a good reflection of the city that our highest paid employees by and large don't live here. And miss me with the "they're trying to avoid our high property taxes". Cry me a river!
  2. Pretty big pay disparity between top salaries and median across agencies
    • Not as bad as the private sector but we often see the top salaries being three and four times the median. Not great especially considering many agencies barely pay a living wage ($37,422 per year for a single adult no kids according to MIT Living Wage calculator)